[ad_1]
Torsten Asmus/iStock via Getty Images
Defining Inflationary Environment
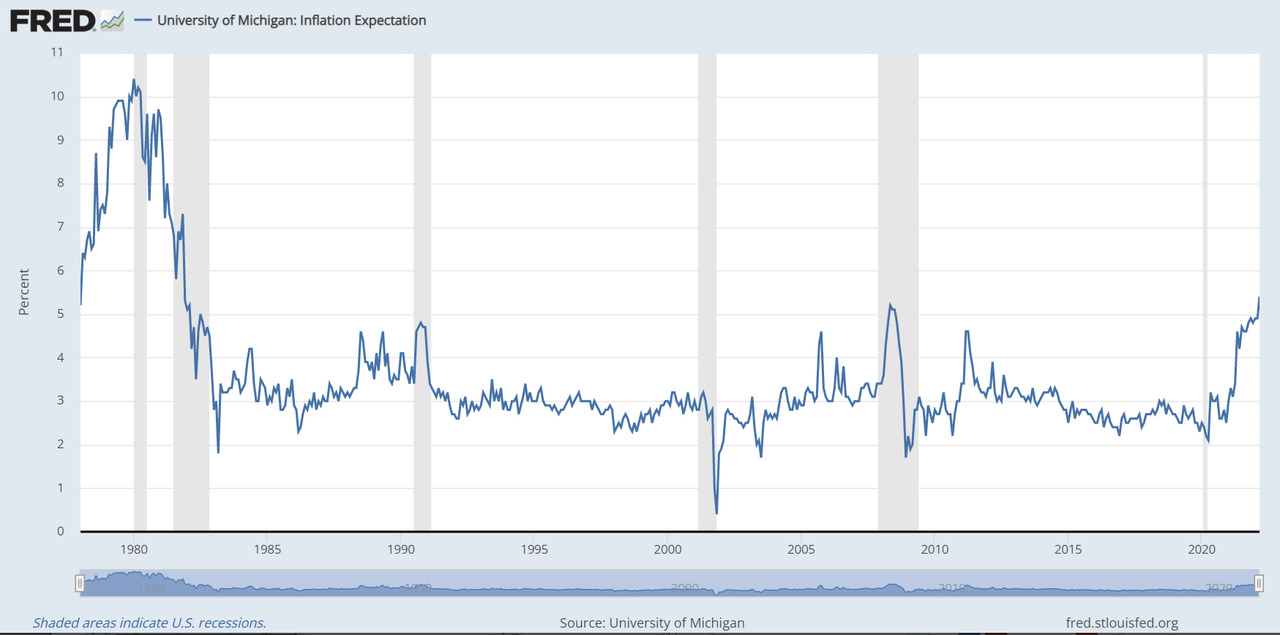
Reference is made to the University of Michigan: Inflation Expectation© series (MICH).
Surveys of Consumers, University of Michigan, University of Michigan: Inflation Expectation© (MICH), retrieved from FRED, (Accessed on 5/4/2022) (FRED)
For this study an inflationary environment was assumed to exist when simultaneously both MICH greater than 3.2% and the 6-month moving average of the inflation rate is also greater than 3.2%.
Both series have monthly data, but are not point-in-time. The series values are listed with the date of the first day of the month to which they refer. Since the MICH values are only known at the end of the month, and the inflation rate values near the end of a month, one has to add one month to the dates of the series for a real-time series.
Evaluating Popular Asset Classes For Inflation Protection
The Investopedia article “9 Asset Classes for Protection Against Inflation” considers the following asset classes and corresponding ETFs for inflation protection:
- Gold – SPDR Gold Shares ETF (GLD)
- Commodities – iShares S&P GSCI Commodity-Indexed Trust (GSG)
- A 60/40 Stock/Bond Portfolio – 60% SPDR S&P 500 ETF (SPY) / 40% Vanguard Total Bond Market Index Fund (BND)
- Real Estate Investment Trusts (REITs) – Vanguard Real Estate ETF (VNQ)
- The S&P 500 – SPDR S&P 500 ETF (SPY)
- Real Estate Income – VanEck Vectors Mortgage REIT Income ETF (MORT)
- The Bloomberg Aggregate Bond Index – iShares Core U.S. Aggregate Bond ETF (AGG)
- Leveraged Loans – Invesco Senior Loan ETF (BKLN)
- TIPS – iShares TIPS Bond ETF (TIP)
Table-1 below lists the total returns and excess returns over SPY for the various asset class ETFs when invested during the defined inflationary periods of the Risk-on and Risk-off phases signaled by the iM-Multi-Model Market Timer. The performance was obtained by backtesting over the period 2005-2022 using the online portfolio simulation platform Portfolio 123 which provides historic data for stocks and ETFs from 1999 onward and also some historic economic data.
| Table-1 Risk-on & Risk-off Inflationary Periods Total Returns 2005-2022 | ||||||
| Symbol | Risk-on periods Total Return | Risk-on periods Excess Return over SPY | Risk-off periods Total Return | Risk-off periods Excess Return over SPY | Risk-on & Risk-off periods Total Return | Risk-on & Risk-off periods Excess Return |
| (VNQ) | 113% | 50% | -45% | -5% | 68% | 45% |
| (GSG) | 84% | 21% | -62% | -22% | 22% | -1% |
| 60% SPY / 40% (BND) | 32% | -31% | -22% | 18% | 10% | -13% |
| (GLD) | 23% | -40% | -12% | 28% | 11% | -12% |
| (TIP) | 0% | -63% | -1% | 39% | -1% | -24% |
| (AGG) | -2% | -65% | 5% | 45% | 3% | -20% |
| (SPY) | 63% | – | -40% | – | 23% | – |
| Risk-on & Risk-off Inflationary Periods Total Returns 2011-2022* | ||||||
| (BKLN) | 10% | -14% | -1% | 4% | 9% | -10% |
| (MORT) | 8% | -16% | -1% | 4% | 7% | -12% |
| (SPY) | 24% | – | -5% | – | 19% | – |
* ETFs MORT and BKLN return is for the period 2011-2022 as their inception dates are in 2011.
It is apparent that for all the inflationary periods during the Risk-on and Risk-off phases only ETF (VNQ) provided some inflation protection over benchmark ETF (SPY), while none of the other asset classes provided any protection.
Better Asset Classes For Inflation Protection
Better inflation protection during Risk-on phases is provided by ETFs of the energy sector. The Energy Select Sector SPDR Fund (XLE) showed excess returns over SPY of 204% and the Invesco Dynamic Energy Exploration & Production ETF (PXE) provided the highest excess return of 283%. During Risk-off phases the ProShares Short S&P 500 ETF (SH) produces the highest excess return over SPY.
| Table-2 Risk-on & Risk-off Inflationary Periods Total Returns 2005-2022 | ||||||
| Symbol | Risk-on periods Total Return | Risk-on periods Excess Return over SPY | Risk-off periods Total Return | Risk-off periods Excess Return over SPY | Risk-on & Risk-off periods Total Return | Risk-on & Risk-off periods Excess Return |
| (PXE) | 346% | 283% | -58% | -18% | 288% | 265% |
| (XLE) | 267% | 204% | -50% | -10% | 217% | 194% |
| (SH) | -48% | -111% | 47% | 87% | -1% | -24% |
| (SPY) | 63% | – | -40% | – | 23% | – |
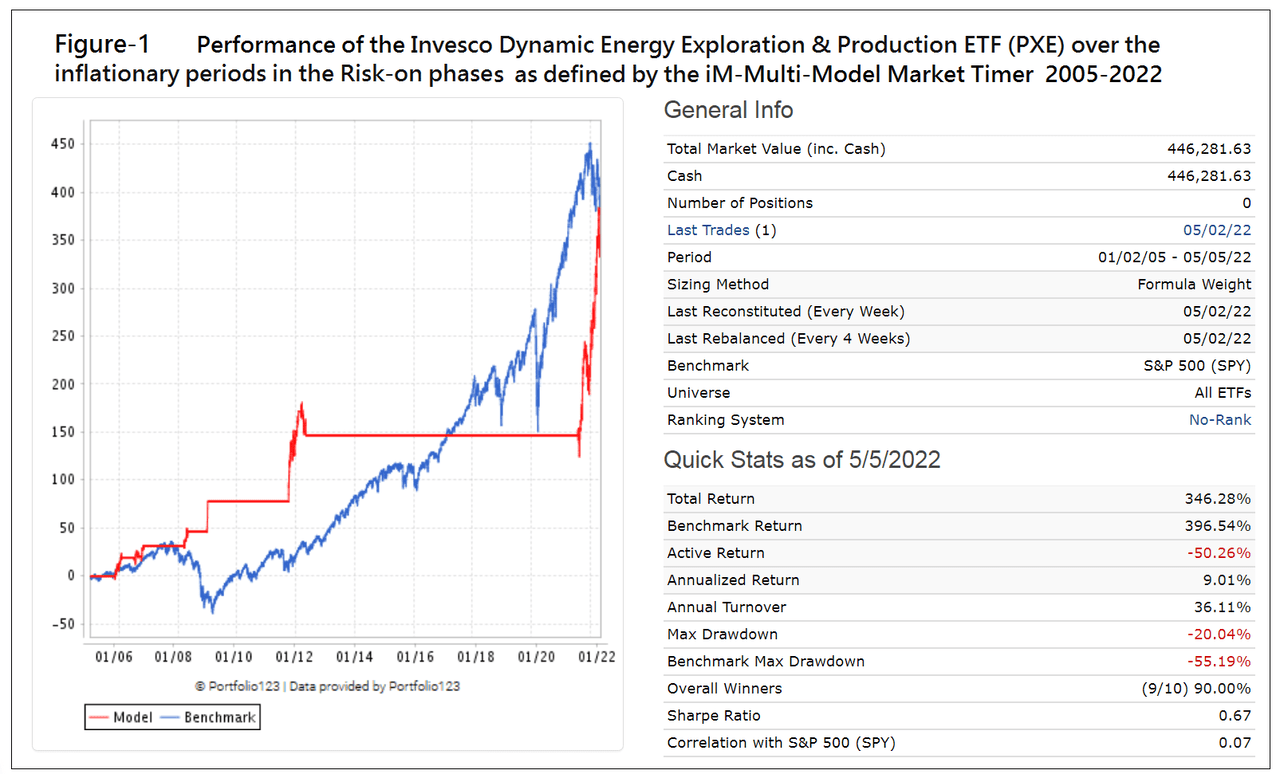
Figure-1 shows the performance of PXE for all the inflationary periods during the Risk-on phases signaled by the iM-Multi-Model Market Timer. Note that in the “General Info” the Number of Positions= 0 and Last Trades (1) = 05/02/22. This indicates that the model sold PXE and the Risk-on phase ended on May 2, 2022.
iMarketSignals
Conclusion
It would appear that the best inflation protection is provided by energy sector funds and to a lesser extent by real estate sector funds. However, the analysis shows that during down-market periods they also underperform SPY, thus providing no protection during Risk-off phases. During those phases fixed income funds or the Short S&P500 ETF (SH) will provide better protection.
For best investment returns it is important to have good timing information for Risk-on and Risk-off phases which the iM-Multi-Model Market Timer could provide. This timer, updated weekly on iMarketSignals.com, switched recently to Risk-off. Since the present inflationary period has not ended the best current asset allocation from the Investopedia list would be AGG, or SH from the “Better Asset Classes” listing.
[ad_2]
Source link


