

[ad_1]
carterdayne/E+ via Getty Images
2022 has brought about a wind of change for so many asset classes. Front and center is the Treasury market. The “Long Bond” aka the 30-year Treasury bond has endured huge losses so far this year. The iShares 20+ Year Treasury Bond ETF (TLT) is down a whopping 21% in 2022, worse than the return on the S&P 500 (SPX). Long-dated Treasuries have not provided any diversification benefit during the current bear market in equities.
Playing the Move in Rates
So investors are curious about ways to play the sharp rise in rates. After all, the U.S. Federal Reserve is hell-bent on increasing its policy rate throughout the year, eventually peaking above 3%, according to the latest CME Fed Watch indicator. Will that portend more bearish price action on long-term Treasuries? If so, what’s the best way to play it?
What is TBT?
ProShares UltraShort 20+ Year Treasury (NYSEARCA:TBT) is a popular vehicle for enhanced short exposure to long-term Treasury securities. When rates rise on the 30yr, the TLT falls and TBT rises by two-times the daily move in the Long Bond. Beware, however, that negative compounding returns can hurt investors who own a leveraged ETF, like TBT, for more than two days when volatility is high. The upside is that if there is a pronounced trend higher in long-term rates over, say, several weeks. TBT’s return can be enormous. So far this year, TBT is up a whopping 51%.
2022 ETF Performances: TBT a Huge Winner
Finviz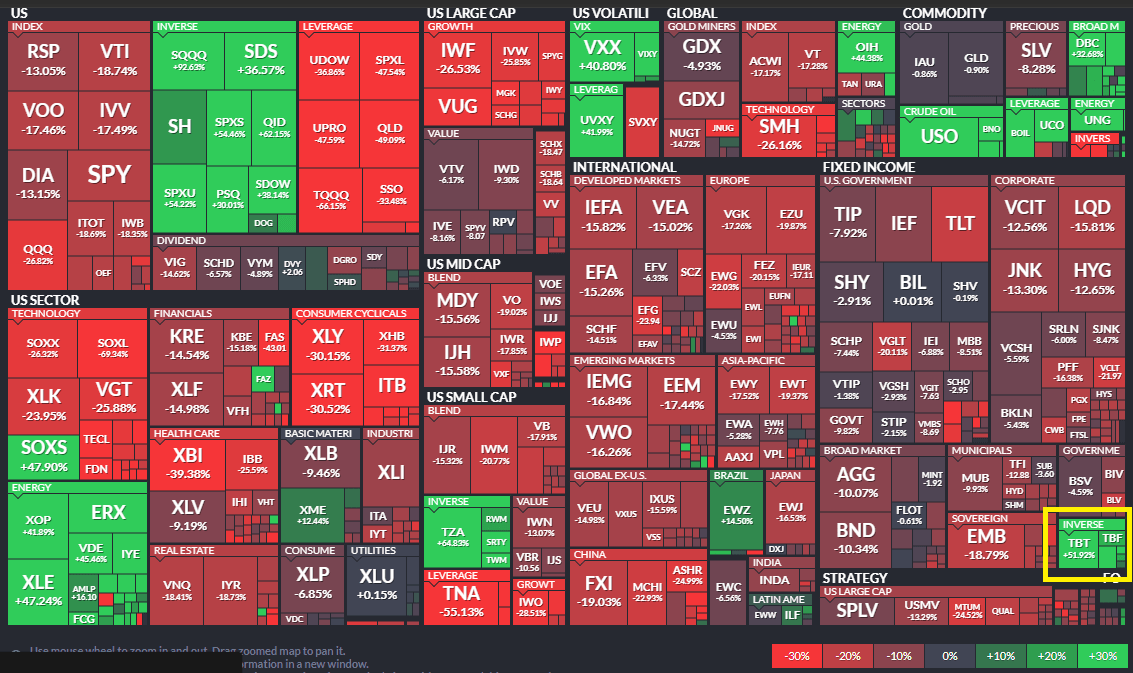
Assessing the Damage
How bad has the 2022 performance of long-term Treasuries been of late? The chart below illustrates that TLT, since early December, is down 25% (and that’s with dividends). Other ETFs that benefit from lower interest rates have fared worse. The PIMCO 25+ Year Zero Coupon U.S. Treasury Index ETF (ZROZ) is a zero-coupon long bond fund. A zero-coupon bond features more duration risk since the investor does not receive dividends along the way. Moreover, the ultra-aggressive Direxion Daily 20+ Year Treasury Bull 3X Shares ETF (TMF) is down more than 55% in that span.
A Bear Market in Long-Term Interest Rates
StockCharts.com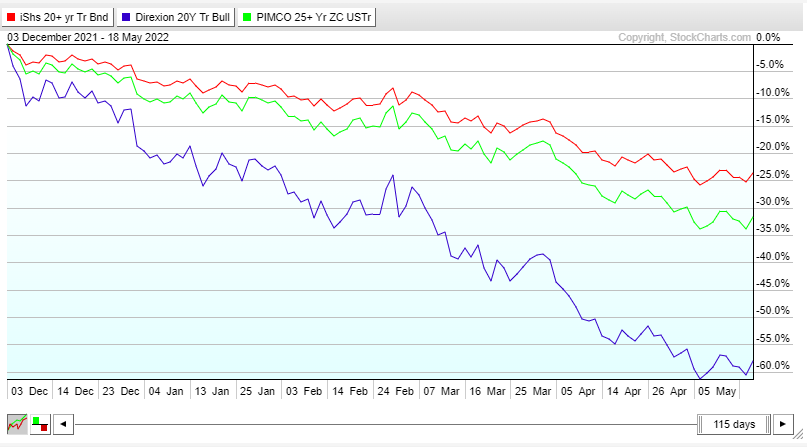
Know Your Duration
It’s important to recognize what a 1% change in interest rates will do to a fixed-income position. According to J.P. Morgan Asset Management’s April 2022 Guide to the Market, while the 30-year Treasury Bond features a 0.93 correlation to the 10-year U.S. Treasury rate, a 1% rise in the entire yield curve would mean a loss of 18% over a year. That would be bullish for TBT since it is a leveraged inverse ETF.
The Long Bond: Correlations and Duration Impacts
J.P. Morgan Asset Management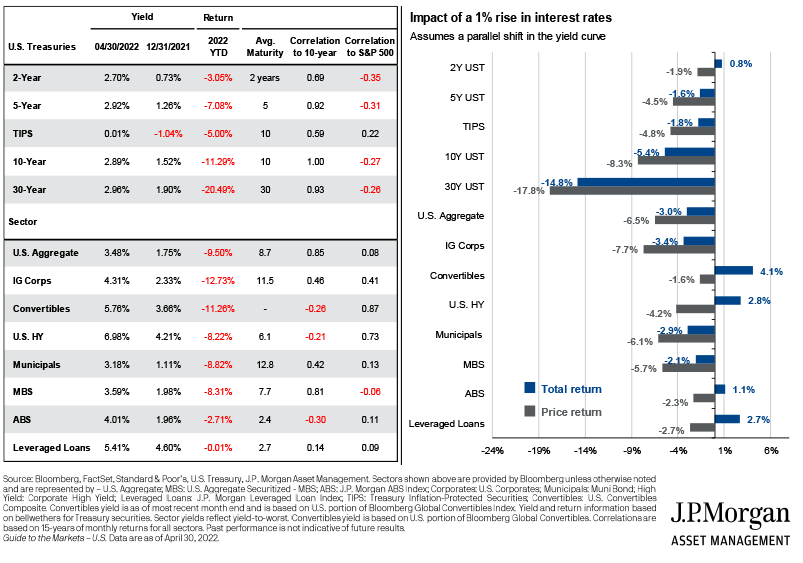
Knowing How to Trade Rates
So what’s my call on TBT? Let’s first look at the trend in the Long Bond (TYX). As a technician, horizontal lines on a chart are more important to me than downtrend or uptrend lines. In this case, TYX is near its multi-decade downtrend resistance line, but I see more significant resistance near the 4% mark. So I think there could be a brief pause in TYX, but longer term, I think 4% is in play.
30-Year Treasury Rate Trends: 4% In Play?
StockCharts.com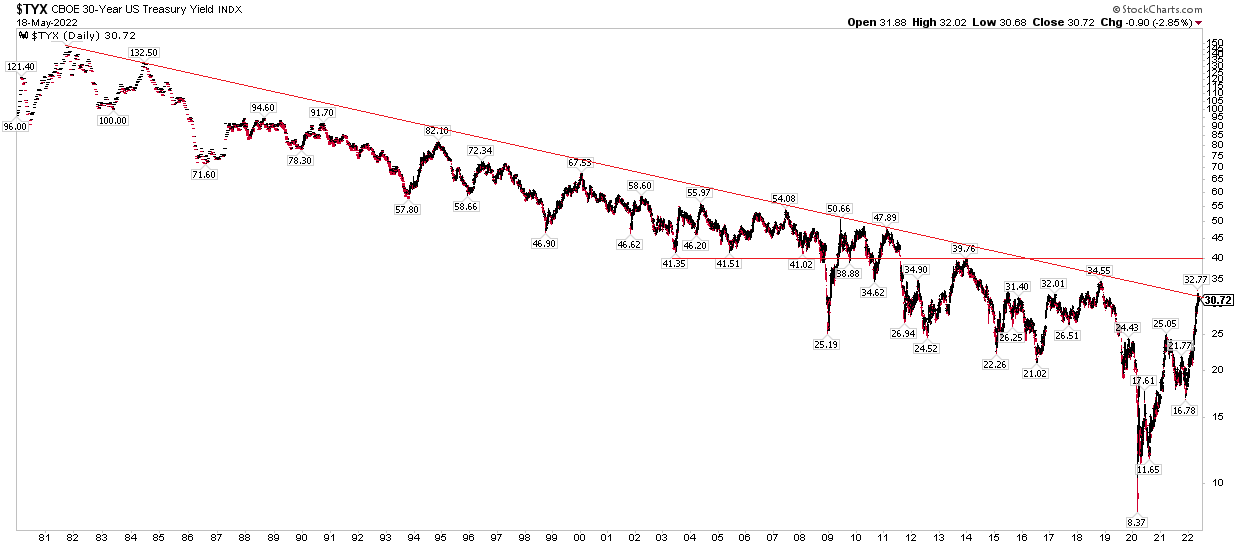
TBT: Levels to Watch
As for TBT itself, there is resistance just above $27. The late 2019 peak was matched earlier this month. I am cautious on TBT until it gets above that. Above $28, there is a good amount of bearish overhead supply in the $39 to $43 range, so that will be tough slogging for the TBT bulls. Keep in mind that TBT rises when the 30-year Treasury rate increases. On the downside, TBT has support at $23.
TBT Technical Chart: Near-Term Resistance and Long-Term Supply
StockCharts.com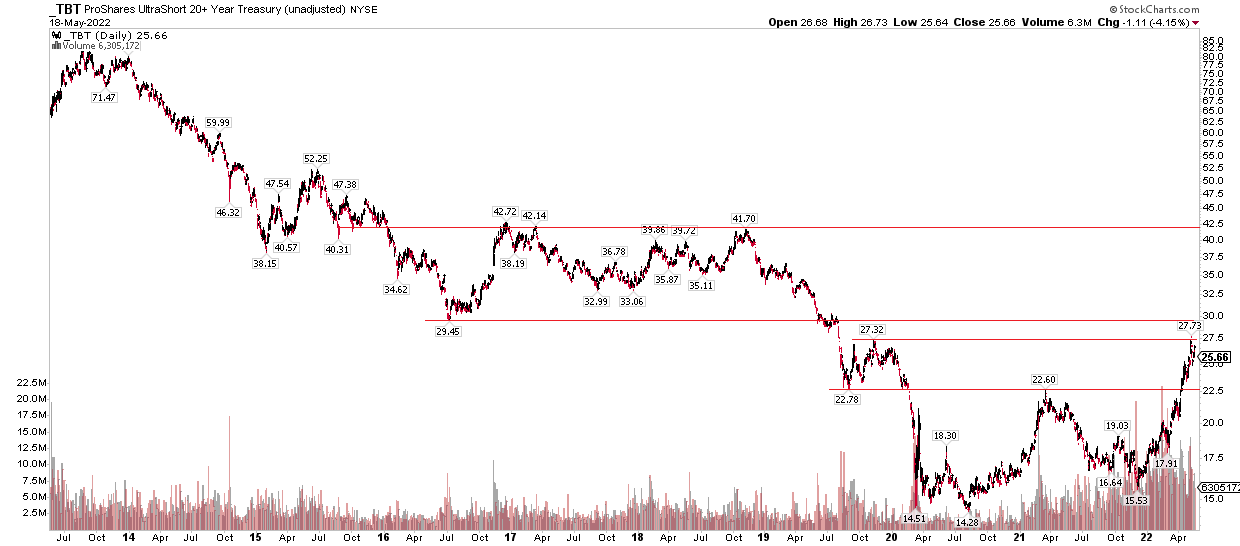
The Bottom Line
I see the 30-year Treasury rate pulling back in the near term, but ultimately heading toward 4%. That outlook implies a bearish near-term view on TBT, perhaps backing away from its $27+ recent high and retesting the $23 area of support. Longer-term though, traders should keep a close eye on an ultimate target in the low $40s.
[ad_2]
Source link


