[ad_1]
Co-produced by Austin Rogers
z1b/iStock via Getty Images
We all know that no trends in the world of finance carry on forever, but it is extremely difficult to recognize in real-time when a trend has reached its end and is about to reverse course.
- Few identified the peak of tech stock (QQQ) (ARKK) mania in the late 1990s. Very few sold at the time, despite ludicrously high valuations.
- Few recognized when the housing market (HOMZ) had peaked in the mid-2000s. Home prices had been losing value for over a year before the financial crisis even started.
- Few understood the money available to be made in cryptocurrencies (BTC-USD) throughout most of the 2010s, and even fewer saw the inevitable crashes that followed strong runs.
- Strikingly few predicted the huge spike in inflation we are currently enduring, and now strikingly few are predicting that the rate of inflation will dramatically fall.
On that last point, there are some solitary voices that proclaim we have probably reached “peak inflation” – not peak prices, but peak growth of prices.
Likewise, there are some signs that we are at least near a peak in long-term (over 3-year in length) interest rates. To be clear, there are a lot of moving parts in the global and domestic economy right now that make forecasting extremely difficult. Properly working crystal balls are hard to come by these days. (Blame it on the supply chain.)
But we do believe that it would be a good idea for investors to hear and consider the argument that long-term interest rates are close to peaking or have already peaked. There is often a significant lag between the emergence of financial data and the popularization of narratives about that data. The danger is that investors could prepare their portfolios for persistently high inflation and interest rates that doesn’t turn out to persist for very long.
With that, let’s look at four reasons why we might be near a peak in long-term interest rates.
1. The Fed Funds Rate Is About To Shoot Higher
We specify “long-term” interest rates because the Federal Reserve has made abundantly clear their plans to rapidly hike the shortest end of the interest rate curve.
They recently hiked interest rates by 50 basis points (half a percentage point) rather than the typical 25 basis points. If the Fed’s “dot plot” forecast is to be trusted, then the key Fed Funds rate (read: the 24-hour or “overnight” interest rate used by banks) should reach as high as 2% at the end of 2022. That is after starting the year at effectively zero.
The Treasury market is pricing in a very rapid rise in the Fed Funds rate. Historically, the 2-year Treasury yield has followed the Fed Funds rate in a very tight correlation. Today, there is a huge air pocket between the 2-year yield and Fed Funds rate.
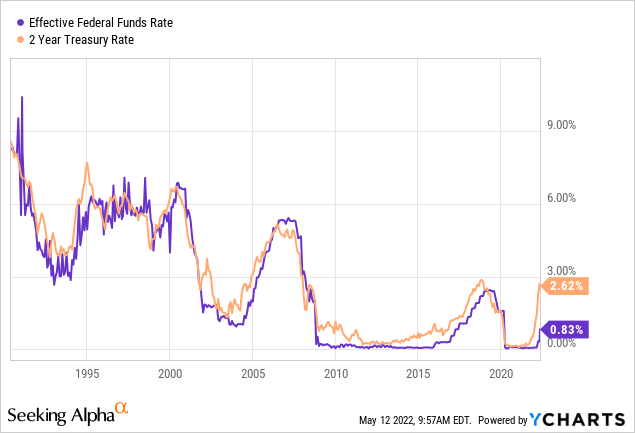
Let’s zoom in on the last five years to see this gap between the 2-year and Fed Funds rate clearer.
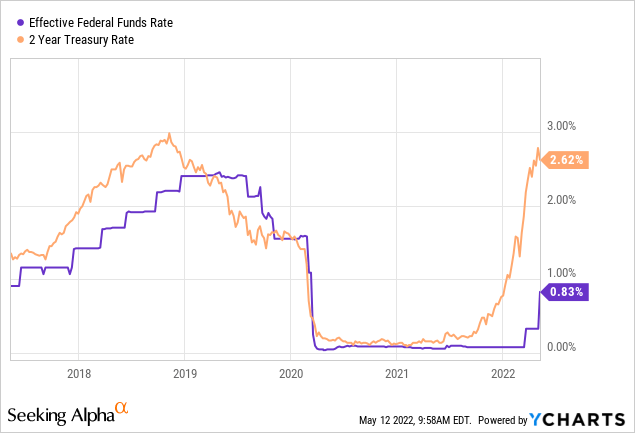
The gap is nearly 200 basis points wide, which is historically unprecedented. During the early 1980s, when Fed Chairman Paul Volcker pushed the Fed Funds rate up to ~20%, there was a sizable gap between these two yields, but in the other direction: the Fed Funds rate was higher than the 2-year yield.
If the 2-year yield is any guide, then we can summarily state that the Fed has never been as behind the curve on rate hikes as they are today.
The bond market, which is typically considered “smart money,” is projecting that the Fed will raise their key rate very rapidly. At least for now, the bond market is convinced that the Fed isn’t bluffing about the amount of rate hikes they have planned.
How does this portend peaking long-term interest rates? On its own, you might think it doesn’t. But keep this first point in mind when looking at the next point.
2. The Cost of Higher Interest Rates Will Increasingly Weigh On The Economy
Falling interest rates stimulate the economy by encouraging businesses and consumers to borrow. Think of the frenzy among homebuyers to secure a home after mortgage rates dropped so steeply in 2020. Lower interest rates are meant to catalyze “demand creation.”
So, on the other hand, when inflation is raging, how exactly do the Fed’s interest rate hikes cool down the economy? Though “demand destruction.” It works exactly as it sounds. A higher Fed Funds rate leads to a higher bank prime rate, higher mortgage rates, and higher annual percentage rates for all sorts of big-ticket consumer goods like vehicles and furniture.
- A higher bank prime rate, off of which many business and real estate loans are based, discourages borrowing for business purposes.
- A higher mortgage rate discourages homebuyers from entering the housing market.
- Higher APRs discourage consumers from buying new cars or furniture that would require financing.
Generally speaking, when borrowing slows, the whole economy slows.
Moreover, given that debt levels are today significantly higher across the board (government, business, and consumer) than they were prior to COVID-19, rising borrowing costs also affects the tremendous amount of debt that is already in the system.
For instance, after dipping in 2020 due to the plunge in interest rates, the government’s total interest expenses rebounded in 2021 and are sure to shoot much higher this year.
US interest expense is rising rapidly (YCHARTS)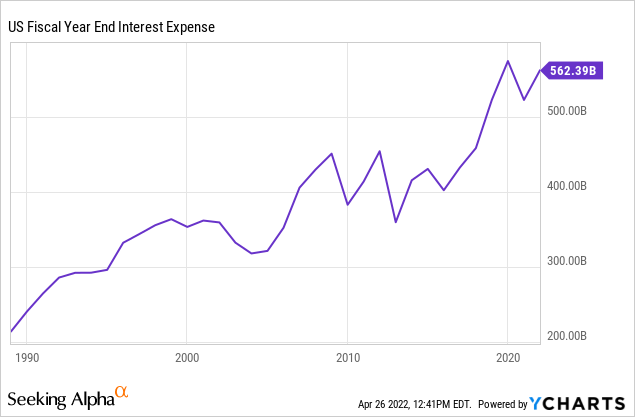
Likewise, household debt service as a percentage of disposable income dropped significantly after the pandemic arrived, but that was only because borrowing costs like the 30-year mortgage rate dropped so much.
Household debt service as a percent of disposable income is rising (YCHARTS)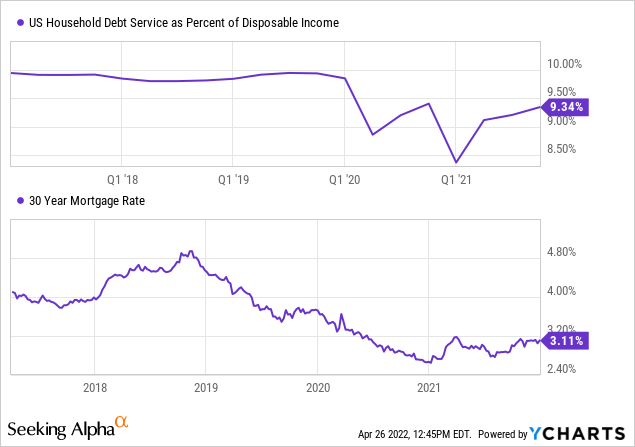
Today, the 30-year mortgage rate has spiked up to 5%, and other consumer borrowing costs have rebounded along with it. This will translate into a substantially higher share of disposable income going toward interest payments going forward. That leaves less money available for other forms of consumption, which in turn slows the economy.
Likewise, a spike in the bank prime rate (the lowest interest rate that banks can charge to their most creditworthy borrowers) will, over time, raise interest costs for businesses and other individuals that use loans based off the prime rate. This is exactly what happened during the last rate-hiking cycle.
The interest expense of businesses is rising (YCHARTS)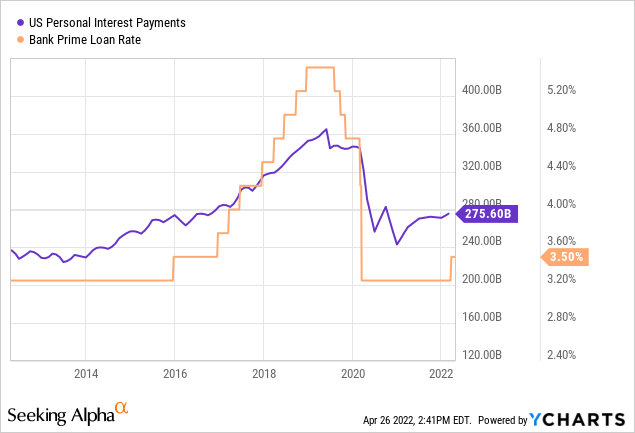
By all indications, the current rate-hiking cycle should be much faster than the last one (see point #1 above), which will result in faster deterioration of economic activity, which in turn should render slower economic growth and lower long-term interest rates.
3. Flat Yield Curve From The 3-Year To The 30-Year
I believe the bond market is already pricing in the above forecast. I believe this because, beyond the 2-year yield, the Treasury yield curve is strikingly flat.
Flat, and especially inverted, yield curves suggest a weakening economy that is vulnerable to significant pain from rising interest rates on the short end of the curve.
Consider that the yields on the 3-year Treasury bond and the 30-year Treasury bond are within 30 basis points of each other.
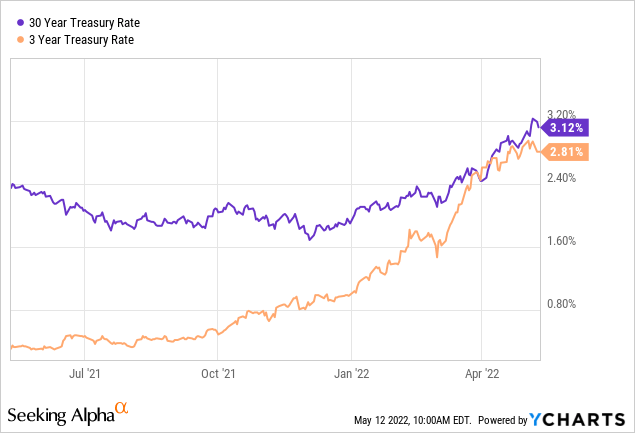
These two almost never invert. That is, the 3-year Treasury yield almost never goes higher than the 30-year Treasury yield. When the two yields get as close as they are today, it is usually, but not always, a precursor to an oncoming recession. Notice that in 1990, the early 2000s, 2006-2007, and, to a lesser extent, 2019, a flat or inverted 3-year/30-year spread portended an ensuing recession.
The spread between the 3-year and 30-year treasury rate is historically small (YCHARTS)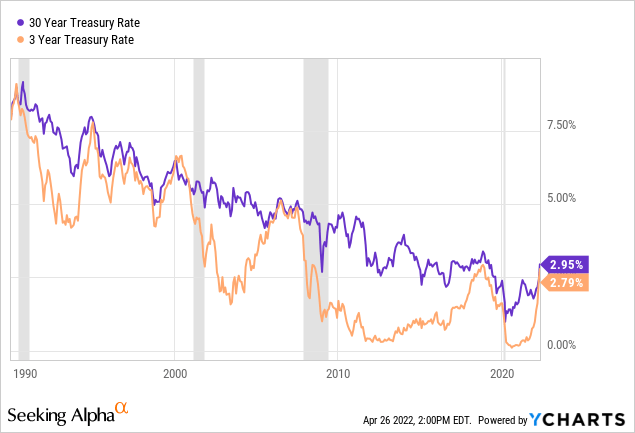
You may also notice that the 3-year/30-year spread became very tight in the mid-1990s without leading to a recession. Moreover, the spread became and remained tight for over a year in 2006-2007, indicating that this flatness can persist for a time.
The most important point to note from the above chart, however, is that in 100% of cases of a flat spread between the 3-year and 30-year Treasury yields since 1990, both the 3-year yield and the 30-year yield were lower within a few years. In all cases except 2006-2007, the yields were lower within a few months after becoming as flat as they are today.
Interestingly, as of April 22nd, the 30-year Treasury bond offered the exact same yield as the 7-year Treasury bond (IEF): 2.95%.
Interest rate spreads are very small (YCHARTS)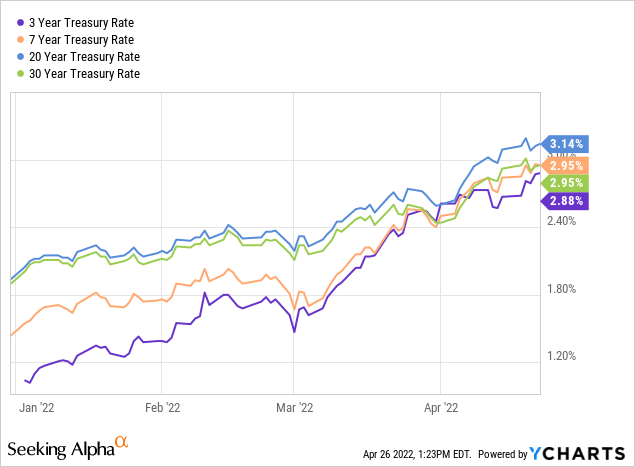
If you look closely at the beginning of April, you will notice that the 3-year Treasury yield briefly rose higher than both the 7-year and 30-year yields.
The primary point to take away is that the yield curve is remarkably flat from the 3-year to the 30-year:
Treasury yield curve (US Treasury Department)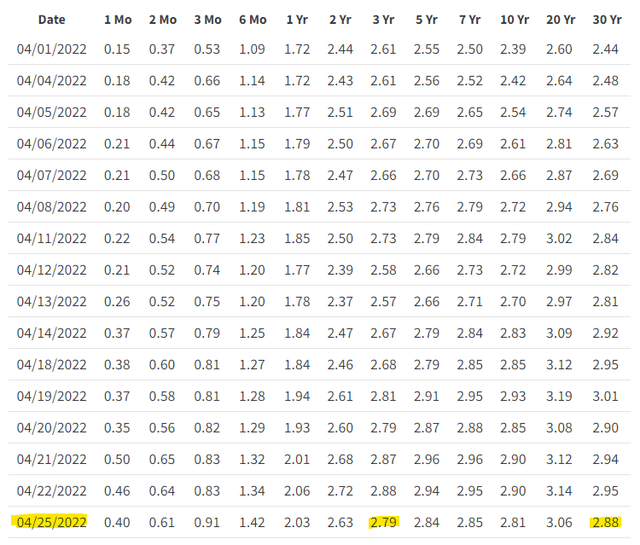
Note that the spread between the 2-year yield and the 30-year yield is only ~30 basis points. In other words, one only garners an additional 30 basis points from lending money to the U.S. government for 30 years instead of for 2 years.
As a last point to note here, it should be observed that long-term Treasury rates have peaked at lower levels during each rising rate cycle since the early 1980s. If long-term rates broke above their previous peak, it would truly be momentous, at least insofar as it marks the end of the 40-year trend of lower peaks.
Long term treasury rates are approaching their past peak (YCHARTS)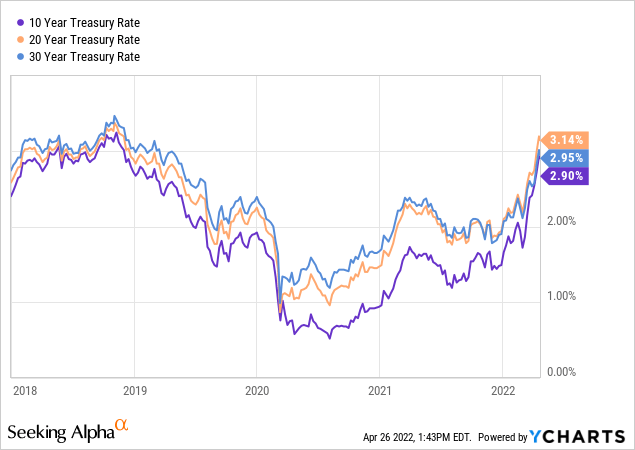
As you can see above, however, long-term Treasury rates have not exceeded their previous peak from late 2018. They are getting close, but they have not exceeded the peak.
4. Long-Term Treasury Yields Fell During The Last Round of Quantitative Tightening
The Fed has nearly finished tapering its purchases of government securities and mortgage-backed securities, and the central bank could begin the process of reducing its balance sheet assets as early as May.
Thus, we are nearing the end of “quantitative easing” and are able to go into “quantitative tightening.”
Quantitative tightening is beginning (YCHARTS)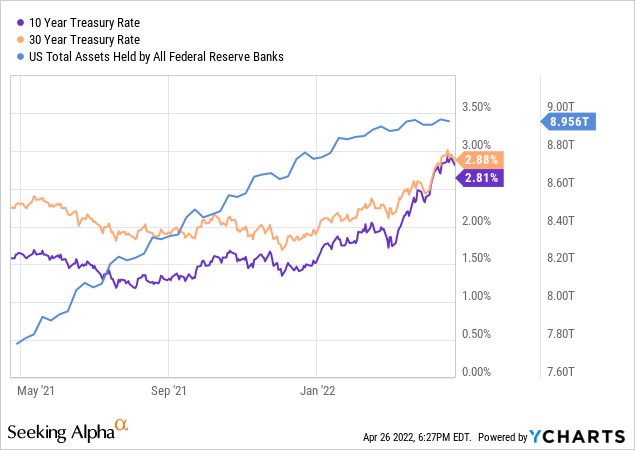
What did long-term interest rates do last time this happened?
Well, in 2014, as the Fed began to taper its asset purchases, long-term bond yields actually began to drop.
Quantitative tightening causes interest rates to drop (YCHARTS)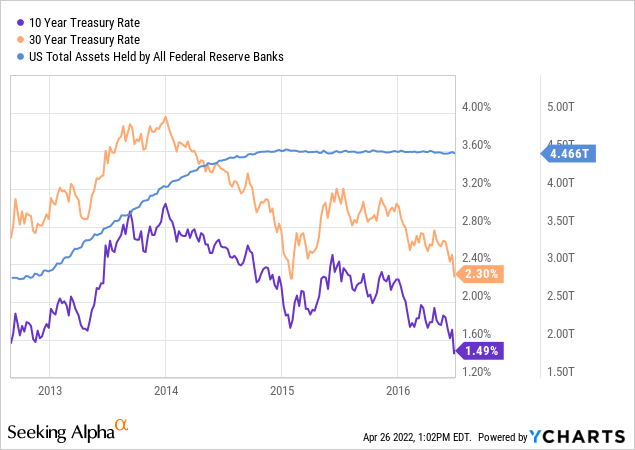
The end of QE brought with it the end of the “risk-on” phase of the market cycle, and investors return to “risk-off” mode by buying the safest assets available: Treasury bonds. This sent Treasury yields downward.
Interest rate hikes did not begin until later, in 2017. Rate hikes along with Fed asset reduction led long-term interest rates to rise for about a year from late 2017 to late 2018.
Fed fails to normalize interest rates (YCHARTS)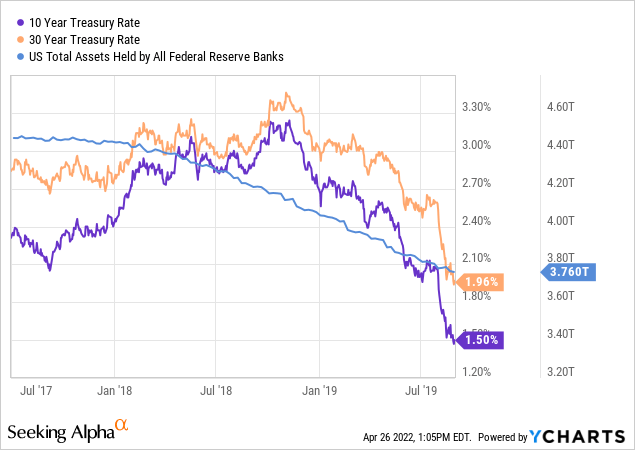
But then, due to demand destruction and otherwise weakening economic growth, long-term rates began to drop again.
This time, however, the whole monetary tightening process is going into overdrive. Rapid Fed Funds rate hikes are going to come right alongside rapid reduction in the Fed’s balance sheet.
Considering how much interest rates on the long end of the curve have already risen, it appears likely that we are near the peak.
We have tried to normalized interest rates for decades and consistently failed (YCHARTS)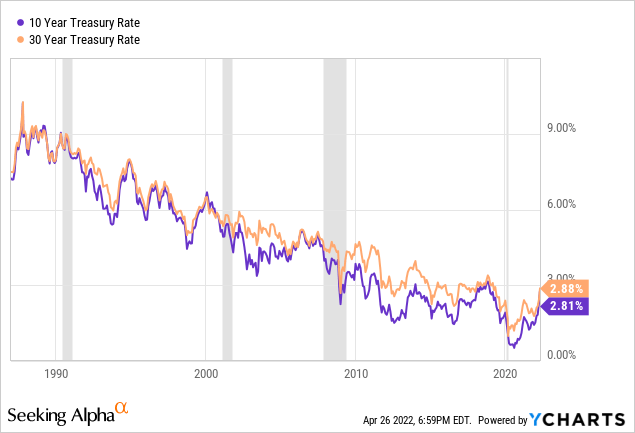
If the 40-year downtrend in long-term interest rates holds, then the current level of long-duration yields would certainly seem to be around a peak.
Bottom Line
If long-term interest rates have peaked and do decline soon, so what?
The takeaway for investors from all of the above is that declining long-term interest rates would be strongly beneficial to high-yielding dividend stocks (DIV) such as those MLPs (AMLP), BDCs (BIZD), and REITs (VNQ) that we target at High Yield Investor.
Right now, many of these companies are exceptionally cheap due to fears of rising interest rates. However, if long-term interest rates peak and begin to decline even as the Fed hikes their key interest rate on the short end, this situation may quickly reverse.
In any case, whether the above argument is right that long-term interest rates are about to peak, or if it is wrong and long-term rates continue rising for years longer, we will remain vigilant in selecting the strongest high yielding companies with the brightest prospects and the best value propositions. That, we believe, is the best hedge against all kinds of risk.
[ad_2]
Source link


