[ad_1]
Diego Thomazini/iStock via Getty Images
This article was first released to Systematic Income subscribers and free trials on May 21.
Welcome to another installment of our CEF Market Weekly Review where we discuss CEF market activity from both the bottom-up – highlighting individual fund news and events – as well as top-down – providing an overview of the broader market. We also try to provide some historical context as well as the relevant themes that look to be driving markets or that investors ought to be mindful of.
This update covers the period through the third week of May. Be sure to check out our other weekly updates covering the BDC as well as the preferreds/baby bond markets for perspectives across the broader income space.
Market Action
It was a relatively flat week for the CEF space – most sector NAVs fell but that was offset by the fact that most sectors experienced tighter discounts. Despite a pretty stable week May looks fairly grim with a -4% average CEF sector return so far.
Systematic Income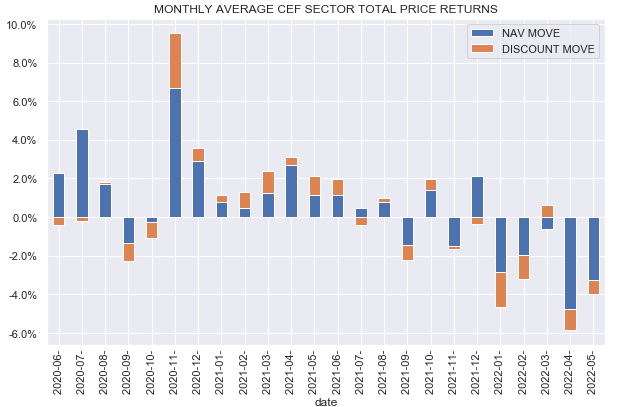
Year-to-date the picture remains pretty similar with MLPs leading the way, followed by a distant second defensive Utilities sectors and lower duration Loan and Agencies sectors. Higher-beta sectors like Converts, REITs as well as longer-duration sectors like Munis are at the back of the line.
Systematic Income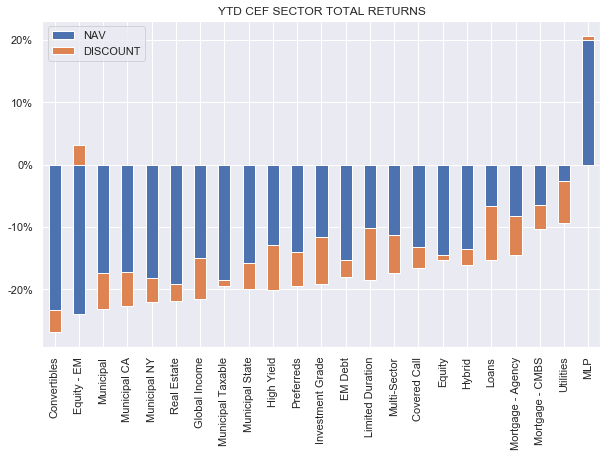
Fixed-income sector discounts remain attractive while equity sector discounts are still fairly expensive.
Systematic Income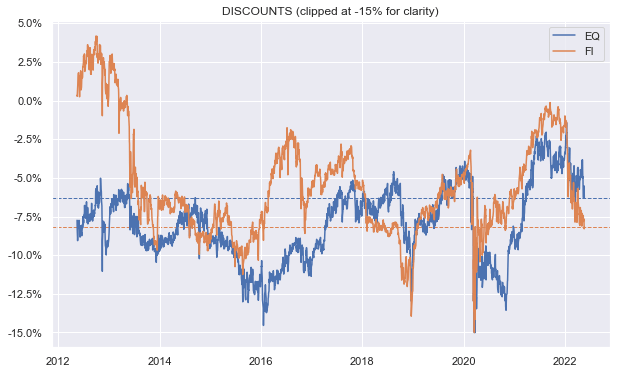
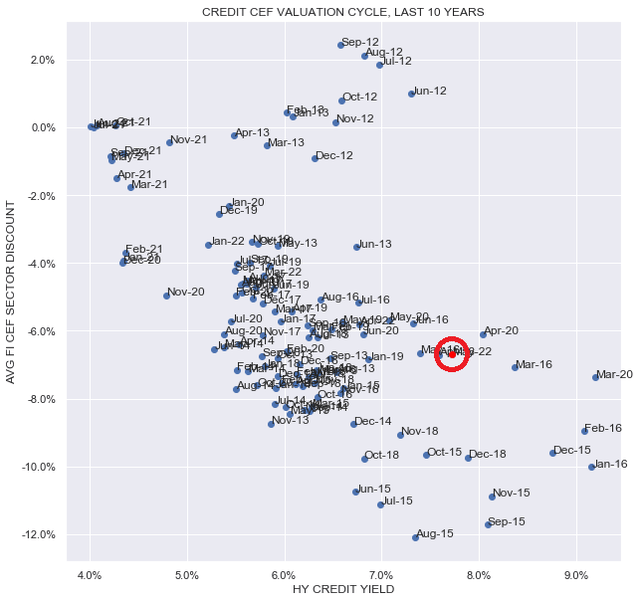
The overall valuation picture for the credit CEF space is very attractive. Underlying asset yields as proxied by high-yield corporate bond yields (x-axis) as well as fixed-income CEF sector discounts (y-axis) have rarely been better in the last 10 years.
The only months valuations have been more attractive are in the Energy crash period when 20% of the Energy / Natural Resource sector defaulted, the brief end-2018 Fed QT “auto-pilot” induced market drop and the two months of the COVID shock. Obviously, the key differentiator between now and those periods are that inflation is unusually high which explains the high bond yields we are seeing but the overall macro backdrop is much stronger than in those other periods.
Market Themes
Year-to-date the HY CEF sector is down about 12% in total NAV terms versus only about 6% for the Loan CEF sector. This dynamic as well as the long-awaited rise in interest rates has made most investors position away from interest-rate sensitive assets such as bonds and toward floating-rate assets like Loans.
However, one of the behavioral biases that investors have to be aware of is the tendency to extrapolate current trends. For instance, it is very tempting to ditch all duration securities such as bonds or preferreds and go all into floating-rate assets like loans. However, in our view, the recent rise in risk-free rates as well as the increase in recession estimates argue for some allocation to bonds, even an increase from current levels.
Let’s take a look at two arguments why many investors may want to pile into floating-rate instruments. One argument goes that in a period of rising rates loans should outperform bonds as their prices are bid up in anticipation of higher coupons and as they start to deliver higher coupons with rising rates.
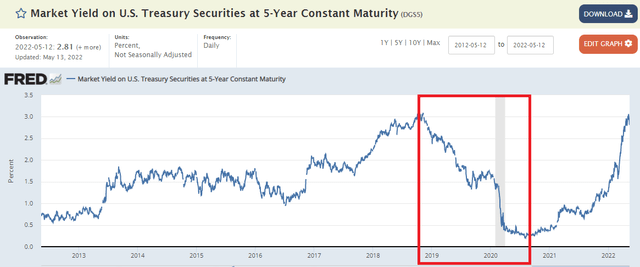
We can look back to the previous hiking period starting at the end of 2015 which lasted till the end of 2018 when it was cut short by the market.
FRED
If we look at the period from the start of 2017 (starting roughly when the Fed funds rate was at about the same level as it is now) to the end of 2018 we see that, at least judging by CEF total NAV returns, high-yield bonds actually either outperformed or kept pace with Loans for most of this period.
Systematic Income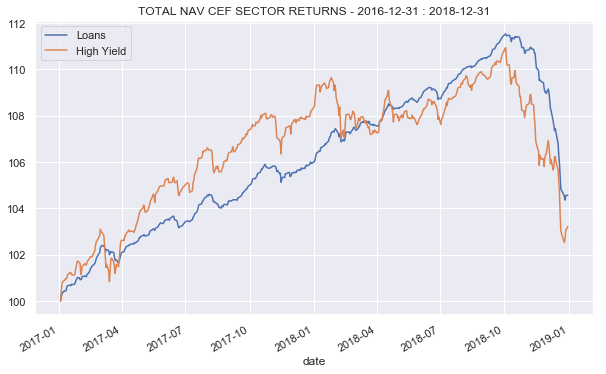
When a recession started to get seriously priced in late 2018 investors began to worry about a yield curve inversion. This period was characterized by falling long-term rates which accelerated during the COVID crash.
In this period High-Yield CEF Sector total NAV return significantly outperformed that of the Loans sector.
Systematic Income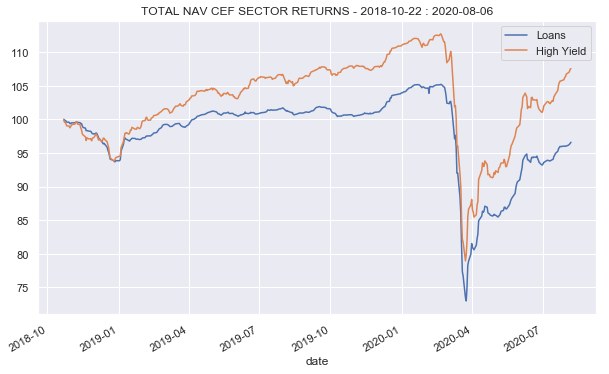
That’s all well and good, some investors might say, but the second argument is that Loans will really shine when economic push comes to shove and companies start defaulting. For that scenario let’s take a look at how the sectors performed during the GFC. It is true that Loans had a lower default rate and a higher average recovery than bonds but it wasn’t enough to drive a higher total NAV return.
Systematic Income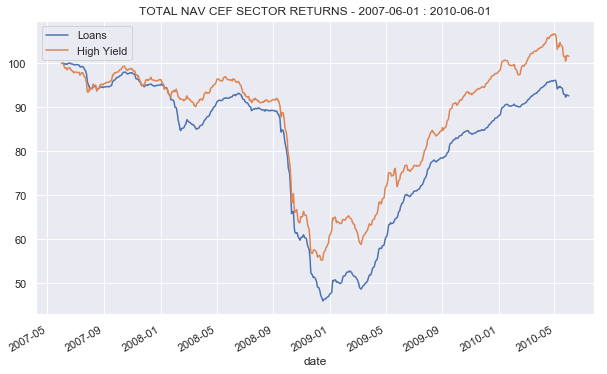
The COVID crash saw pretty similar performance across the two sectors though High-Yield bonds managed to pull away at a later stage.
Systematic Income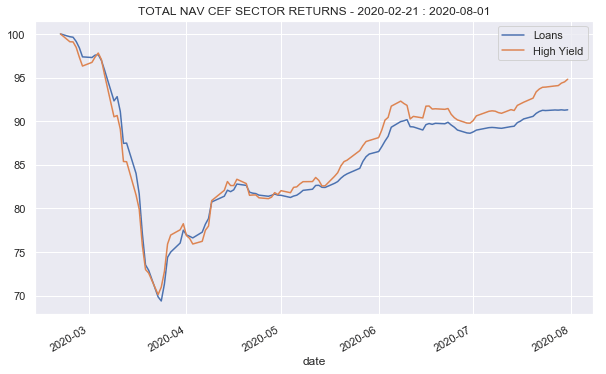
The key point here is not that High Yield bonds are always going to outperform Loans but that Loans will not always necessarily outperform bonds during periods where they should outperform bonds. This is also not to say that investors shouldn’t have some Loan exposure or that High Yield Bonds will not be hurt if Treasury Yields keep rocketing higher.
However, now that 1) Treasury yields appear to have made the bulk of their expected move higher and 2) the likelihood of recession is quite sizable (and hence the likelihood of a drop in longer-term rates is similarly sizable), High Yield Bond allocations should not be ruled out in income portfolios.
When thinking about High Yield or Loan CEF allocations, two key points are worth keeping in mind. First, what are the relative yields between the two assets? And two, how much of the likely move in rates is behind us?
The fact that HY bonds are at a yield advantage versus Loans gives it a performance advantage, all else equal. And two, with 5Y Treasury yields having risen from 0.8% to 2.8% in the last 8 months, very likely the bulk of the rate move is behind us and, hence, the underperformance of the HY sector vs. Loans.
Market Commentary
A couple of distribution changes for Franklin Templeton CEFs. The Western Asset Mortgage Opportunity Fund (DMO) cut by 5% while the Western Asset Diversified Income Fund (WDI) increased by 3%. Not a big surprise for either. DMO has been overdistributing and has been paring its distribution over time. WDI has more than half its portfolio in floating rate assets which is about double its floating-rate facility so its net income has been rising due to the increase in short-term rates.
As expected PIMCO taxable funds deleveraged in the range of 5-15%.
Systematic Income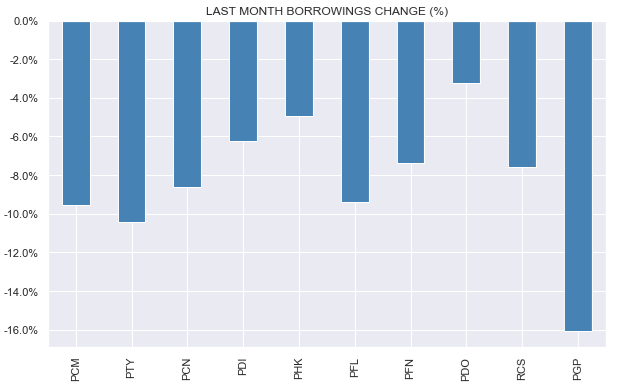
The PIMCO Global StocksPLUS® & Income Fund (PGP) did the most which makes sense given its higher-beta profile due to a significant equity allocation. The PIMCO Corporate & Income Opportunity Fund (PTY) was second which was also not a surprise. Recall in the last PIMCO update we highlighted how its leverage went above 50% despite the fact that its leverage mandate capped its leverage profile at 50%. Given the trajectory of credit fund NAVs over April, it had to do something so it did. PTY leverage is still around 49% so it deleveraged only as much as it had to. Look for a deeper dive on this topic in the next PIMCO update.
Moderate duration High-Yield corporate bonds have been a theme we have focused on because the yield sweet spot is in the 2-4 Year tenors. This means that investors don’t have to take a whole lot of duration risk to capture all of the yield on offer in the corporate bond space. One way to play this theme is via the term CEF Nuveen Corporate Income 2023 Target Term Fund (JHAA) which holds very short-dated bonds – weighted-average maturity is just 1.4. It is also relatively high-quality for a HY bond fund with over 70% of the fund in BB or higher-rated names and relatively low leverage at sub-25%. A discount of 5% amortized to the termination date in Dec-2023 is 3.25% annualized – a nice additional tailwind to its yield of 4.2%. Nuveen has been terminating or offering tender offers at NAV on their term funds like clockwork so they are quite trustworthy in this respect.
The CLO Equity CEF OFS Credit Co (OCCI) discount based on its end-April NAV is 18% which is on the higher end historically both for itself as well as relative to OXLC and ECC. OCCI is firmly the worst-performing fund in this trio so it doesn’t make sense as a structural position but may be worth a tactical fling as it tends to bounce off cheap levels like this one.
Systematic Income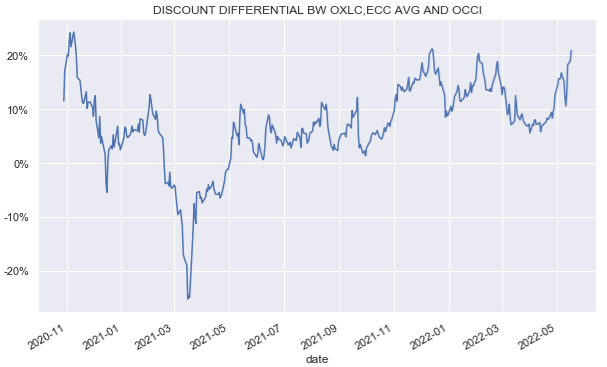
The pair of Invesco target term CEFs Invesco High Income 2023 Target Term Fund (IHIT) and High Income 2024 Target Term Fund (IHTA) reported results. IHIT income increased by 7% YoY with coverage now around 120%. This makes IHIT net NAV yield (i.e. covered yield) 7.2% (IHTA, oddly, has a lower yield at 6.3% despite a longer expected termination date and longer-maturity assets).
The funds will likely see continued income growth into termination due to hedging most of their repo and having some floating-rate assets. With discounts at 3-5% they remain fairly attractive. The risk is that they are put up for shareholder votes to extend without giving investors an exit at the NAV. If this happens it would be worth paring exposure depending on where the discounts are as the vote could get approved by shareholders voting against their interest. The funds have been resilient this year and IHTA remains in the High Income Portfolio.
Stance And Takeaways
The key development over the past few weeks has been the fact that while equities have continued to slide, Treasury yields have stalled and fallen. This has brought some relief to credit assets and lowered their overall sensitivity to the continued drop in stocks. We can see this dynamic in the chart below where the beta of the benchmark High-Yield Corporate Bond ETF (JNK) has halved since its peak in April.
Systematic Income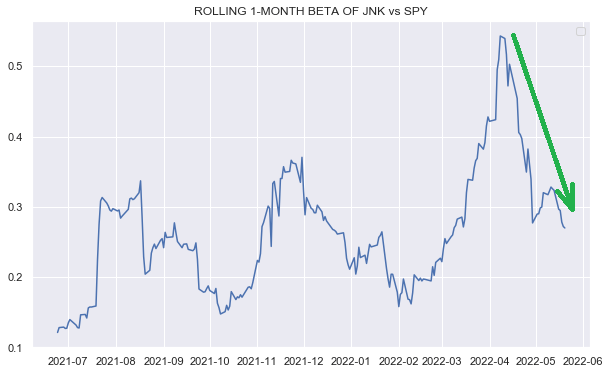
This is likely due to the fact that increasing recession estimates are weighing on Treasury yields. And although credit spreads are likely to rise further in case of a recession, at nearly 5% they are already pricing in quite a lot. The big macro picture is that corporate margins are high, if falling, corporate interest coverage is the highest in 40 years, though falling as well and consumer balance sheets are strong while labor markets are tight. And though the picture is worsening somewhat in the face of continued supply chain difficulties, persistent inflation and other headwinds, it is still pretty good.
Over the past couple of weeks, we have continued to reverse our CEF underweight by adding to funds such as the Western Asset Diversified Income Fund (WDI) trading at a 13% discount and a 10% yield, the Credit Suisse Asset Management Income Fund (CIK) trading at an 8.5% discount and 10% yield, and the Ares Dynamic Credit Allocation Fund (ARDC) trading at a 12.4% discount and a 9.2% yield. These funds all sport modest duration profiles and also have some floating-rate assets that will benefit from the recent rise in short-term rates.
[ad_2]
Source link


